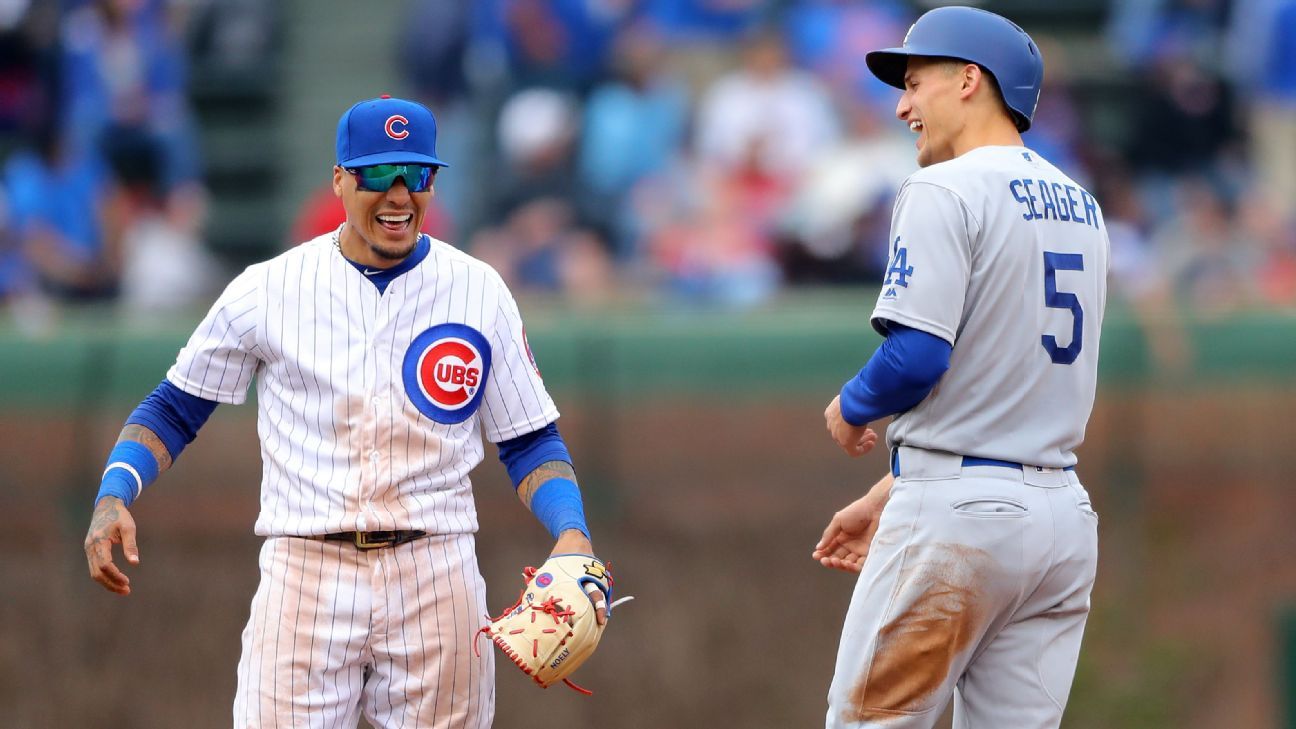
The February 24, 1997 issue of Sports Illustrated featured the young smiling faces of Derek Jeter and Alex Rodriguez on the cover, with the billing that the pair “head up the finest group of shortstops since World War II.” The article highlighted an up-and-coming young class that included Jeter, Rodriguez, Nomar Garciaparra and Edgar Renteria. Miguel Tejada would also come up to the majors that season. Beyond the young stars, Barry Larkin was still around and Omar Vizquel was in his defensive prime.
Jeter and Larkin are Hall of Famers, Rodriguez had a Hall of Fame career, Vizquel might get there, Tejada won an MVP Award, Garciaparra won two batting titles and Renteria was a five-time All-Star. No doubt, it was an excellent era for shortstops. It’s not the finest group we’ve ever seen, however.
No, we’re in the golden age of shortstops right now.
One way to judge this is to compare the offensive production across the position to the major league-wide average. Via Baseball-Reference.com we can look at a statistic called tOPS+, which compares the OPS at each position relative to the overall OPS of the league. The best figure ever for shortstop is 2019 at 103, meaning shortstops hit 3% better than the league average, an impressive figure since shortstop is also a premium defensive position. The second highest figure is 2020.
With that baseline, I thought it would be fun to rank the strength of each position heading into the 2021 season and then see how each position ranks historically, including choosing a golden era at each position. We will list the tOPS+ for 2019 and 2020 for each position and give its ranking among the 101 seasons going back to 1920, so a ranking of 50th or so would mean the position rates about average. Obviously, tOPS+ is an offense statistic, so in picking a greatest season for each position, other factors include defense, single-season and career WAR, Hall of Famers and overall depth.
Two notes: In general, the offensive spread among positions has become more condensed in recent decades. In the 1960s and 1970s, for example, middle infielders were notoriously weak at the plate. The nadir for shortstops since 1920 came in 1973 when they had a tOPS+ of 69 – they hit .237/.291/.301 versus the MLB average of .257/.325/.379. Also, while tOPS+ considers the results of all plate appearances at the position, when I refer to a player as a “left fielder,” for example, he must have played at least 50% of his games in that season at the position.
OK, on to the rankings!
